Running a 150–200 cc commuter fleet durability test without a test track
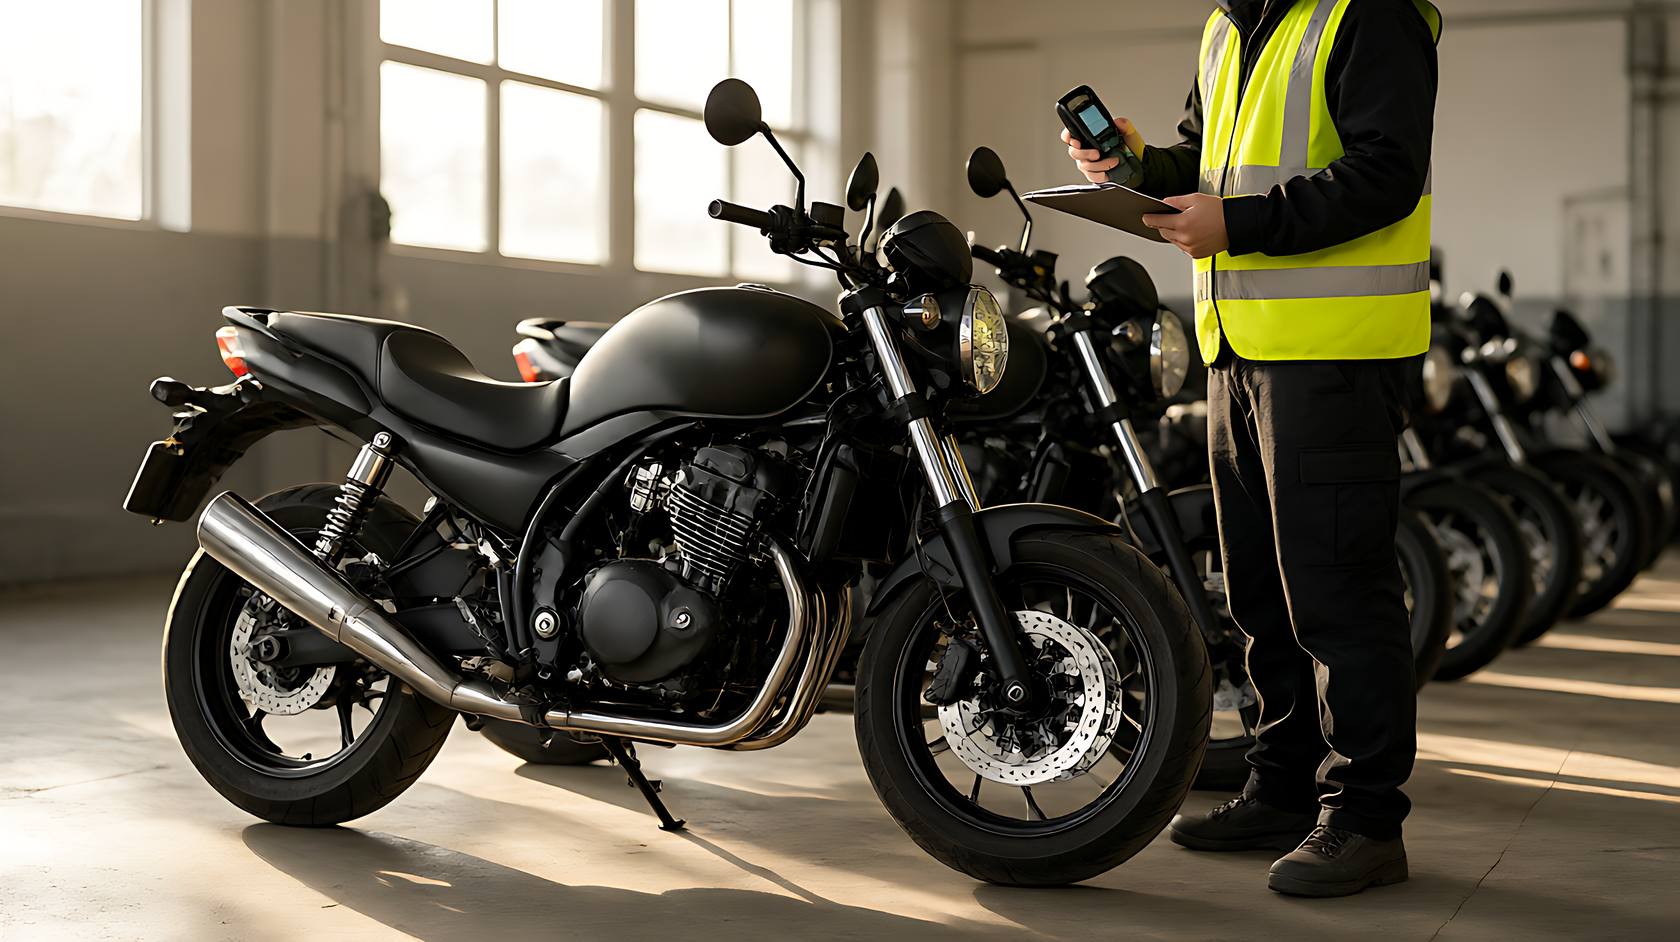
Durability testing sounds like something that happens at a factory with a dyno and a test track. For a distributor or a fleet operator, the useful version is smaller: a defined route, a defined load, a fixed inspection schedule and a record that turns kilometres into cost. That version runs on public roads with riders who are already going somewhere.
The protocol below is written for a 150–200 cc commuter motorcycle used for deliveries or staff transport, where the questions are how long consumables last, which failures repeat, and what the cost per thousand kilometres actually is. It needs ten bikes, one clipboard and a workshop that follows a schedule.
1. Define the route before the first kilometre
A durability test without a fixed route produces anecdotes. Define a loop with a known mix: about 60% urban stop-and-go, 30% suburban at 50 to 70 km/h, and 10% rough surface. Record the distance, the average speed and the number of cold starts per day.
Then keep the route fixed for the whole test. When a route changes mid-test, every wear measurement becomes incomparable, and the test produces a conclusion that cannot be defended. If a road closes, substitute a segment with the same profile and log the change date.
2. Load, riders and the variables you can control
Fix the load: a rider of a stated weight range plus a fixed cargo mass. Fix the tyre pressures and check them weekly. Vary only what you intend to study. A test where load, route and rider all vary measures the weather, not the motorcycle.
Use at least three riders per bike group if you can, and rotate them across bikes. A single rider's habits dominate a small sample, and rotation is the cheapest way to average out braking and clutch use. Log who rode which bike on which day.
3. The inspection schedule
Inspect at fixed intervals: 500 km, 1,500 km, 3,000 km, then every 3,000 km. At each interval measure the same list, in the same order, with the same instruments. Consistency of method matters more than the precision of the instrument.
The list: tyre tread depth at three points per tyre, brake pad thickness front and rear, chain slack and wear, sprocket tooth profile, oil level and colour, coolant level where applicable, fastener torque on a fixed sample of six, battery voltage, and a compression reading on one cylinder per bike where the engine allows it.
Assign one technician to the measurements and keep the same technician for the whole test where possible. Two technicians using the same gauge differently produce a dataset with two populations, and the difference will look like wear. If the technician changes, re-measure a known bike twice and compare before trusting the new numbers.
4. Consumable life as the headline number
The headline output of a durability test is consumable life: kilometres per tyre, per brake pad set, per chain and sprocket set, per litre of oil. Those four numbers drive the fleet's running cost more than any other factor, and they are the numbers a purchasing decision needs.
Record replacement events with the odometer and the reason. A tyre replaced at 8,000 km because it wore to the limit is data; a tyre replaced at 8,000 km because of a puncture is an incident. Keep the two categories separate or the averages become meaningless.
5. Scheduled teardowns
At 10,000 km, take one bike out of service and inspect the parts that cannot be seen from outside: clutch plate thickness, valve clearance, cam chain stretch, wheel bearing play, steering head bearing condition and swingarm pivot play. Photograph each measurement with a scale in frame.
The teardown is where a durability test earns its cost, because the wear that will strand a bike at 25,000 km is visible at 10,000 km if someone looks. A fleet that never opens an engine discovers valve recession as a roadside failure instead of a scheduled adjustment.
6. Measuring the rider-visible symptoms
Ask the same four questions every week: has the bike become harder to start, has fuel consumption changed, has any noise appeared, and has any vibration changed. Record answers as yes or no with a short note. Weekly questions catch drift that a 3,000 km inspection misses.
Fuel consumption is the most sensitive early indicator on a commuter motorcycle. A 5% rise with the same route and rider usually means a dirty air filter, a dragging brake, a worn chain or a tyre pressure problem, and it appears weeks before a rider notices a performance change.
7. Failure classification
Classify every failure into one of four groups: wear, defect, damage and maintenance error. Wear is expected and belongs in the cost model. Defect is a supplier conversation. Damage is an incident and usually a rider conversation. Maintenance error is a process problem in your own workshop.
The classification matters because the four groups have different fixes. A fleet that treats every failure as a defect ends up in an argument with the factory about a bent rim that was actually a pothole. A fleet that treats every failure as damage never discovers its own maintenance gaps.
8. Cost per thousand kilometres
Compute cost per 1,000 km from: fuel, consumables, scheduled labour, unscheduled labour and downtime. Downtime is the number most fleets forget, and for a delivery fleet it usually dominates the others. A bike off the road for two days costs more than a year of chain and sprockets.
Publish the number monthly. A cost per 1,000 km that trends upward while the route is stable is the earliest warning that a batch of bikes is behaving differently, and it is a better trigger for investigation than any single measurement.
9. Sample size and what ten bikes can prove
Ten bikes can prove whether a consumable life target is realistic, and it can reveal a repeat failure. It cannot prove a failure rate below about 10%, because the sample is too small. Know what the sample can answer before the test starts, or the conclusion will overreach the data.
If a repeat failure appears on three of ten bikes, that is a strong signal and worth a supplier conversation. If it appears on one, log it, keep riding, and watch. Treating a single event as a trend is how fleets end up replacing perfectly good components.
10. Terminating the test
Set an end point in advance: 20,000 km per bike, or twelve months, whichever comes first. A test that runs until interest fades produces a dataset with inconsistent intervals. Fix the end point, and take the final teardown on every bike, not just the ones that failed.
Write a one-page result: consumable life per item, cost per 1,000 km, failure list with classification, and three recommendations. Anything longer will not be read by the person who approves the next purchase.
11. What to do with the result
Three decisions come out of a durability test: which consumable specification to buy, which inspection interval to set, and whether the model is suitable for the duty cycle. Those decisions are worth more than the test's cost, and they are the reason to run it on real routes rather than on a track.
Share the result with the supplier in the form of measurements and serial numbers. Suppliers who receive structured field data improve the next batch; suppliers who receive complaints improve their arguments.
12. Seasonal effects that distort the numbers
A durability test that runs across seasons collects two populations of data. Winter riding produces more cold starts, more short trips and more condensation in the crankcase; summer riding produces higher sustained speeds and higher tyre temperatures. Compare intervals within the same season before drawing a trend.
Record ambient temperature and rainfall at each inspection. Two lines added to the sheet explain a wear spike that would otherwise be attributed to a component change. Fleets that skip this step spend months chasing a defect that was a cold snap, and they usually replace a component that was never at fault.
If the test must run across a full year, weight the intervals by season when computing consumable life, or report the life per season separately. A single annual average hides the difference that matters for a fleet operating in a climate with a real winter.
Frequently asked questions
How many bikes do I need? Ten is a workable minimum for consumable life. Fewer than six produces averages that swing on a single event.
Can I run the test on bikes already in service? Yes, if you fix the route and record the starting odometer. A test that begins mid-life is still useful for consumable life, less so for early defects.
What is the most important single measurement? Tyre tread depth at fixed intervals, because it is cheap, repeatable, and predicts the largest recurring cost.
How long before results are useful? Consumable life trends appear by 6,000 km; failure patterns need the full 20,000 km or twelve months.